

Where to Get Infographics and Data Visualisation for B2B Research
Businesses can source B2B research infographics from specialist design agencies, self-serve data visualization platforms, or freelance designers. The optimal choice depends on your budget, timeline, and need for strategic narrative. This guide evaluates the three primary sourcing channels to help you select the right partner for your data storytelling needs. For additional details, review the Contact Us for Professional.
Specialist Design Agencies
Specialist design agencies offer a comprehensive approach to data visualisation by combining strategic research with high-end graphic design. These firms typically operate as full-service partners, handling the entire lifecycle from data interpretation to final artwork delivery. For B2B companies, this model is ideal when the visualisation requires complex narrative structuring or must align with a broader brand identity. For additional details, review the Professional Content Marketing Agency.
Strategic Integration and Brand Consistency
Agency-led projects prioritize brand consistency and strategic alignment. A professional agency will audit your existing brand assets to ensure that new infographics match your established visual language. This includes specific color palettes, typography, and tone of voice. The result is a cohesive content ecosystem where every visual asset reinforces your market positioning.
Goodman Lantern operates as a strategic growth partner in this space. We combine primary research, persona insights, and commercial thinking to create content that drives engagement. Our team handles the creation of print-ready artwork and digital assets, ensuring that the visual output supports your specific business goals. We do not handle physical production; instead, we deliver high-resolution files that your team can use for digital distribution or send to a printer of your choice.
The Research-First Approach
Effective B2B infographics are not just pretty pictures; they are data-driven arguments. Specialist agencies often begin with a research phase to validate the data points before designing. This ensures that the visualisation is not only aesthetically pleasing but also factually accurate and persuasive. By grounding the design in robust data, agencies help brands establish authority and trust with their target audience.
Data Visualization Platforms
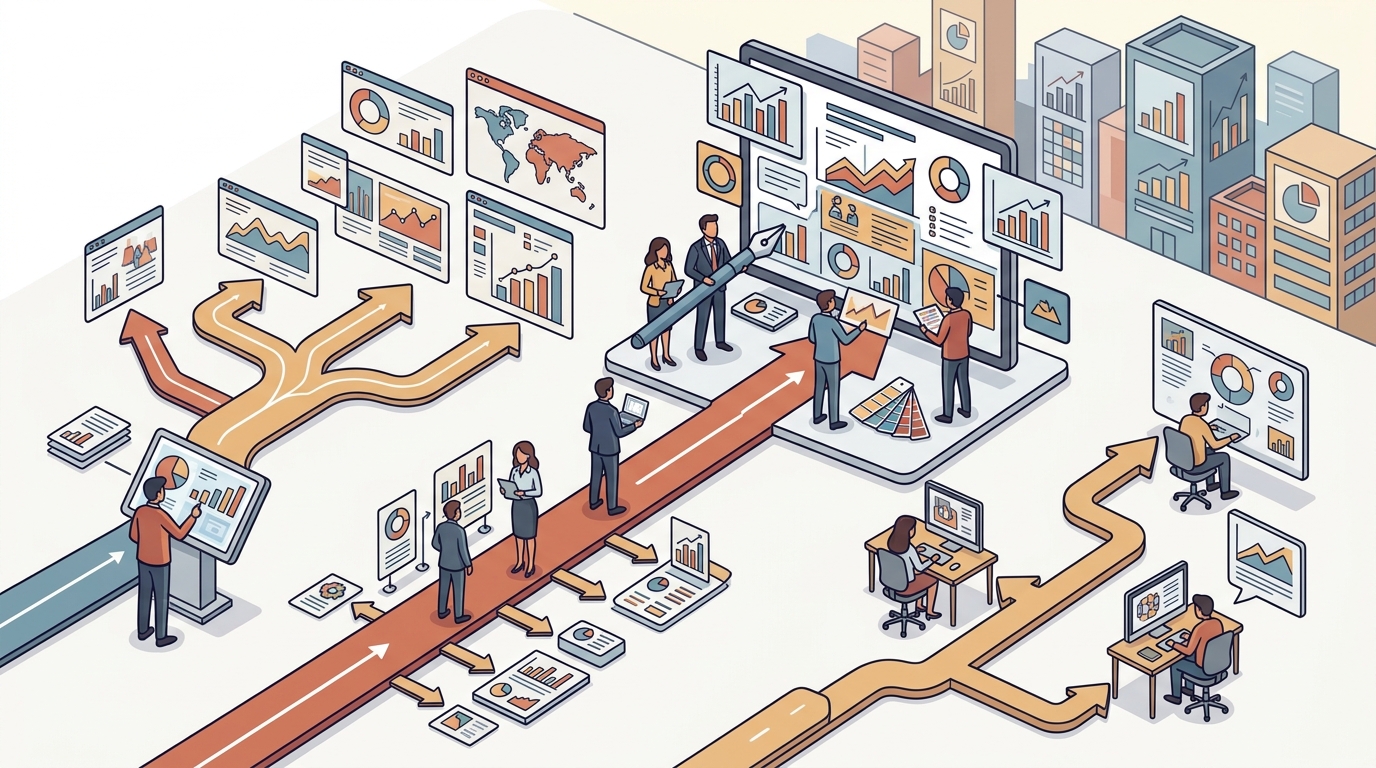
Data visualization platforms are software tools that allow users to create charts, graphs, and dashboards directly from raw data. These tools are best suited for teams with in-house data analysts or marketers who possess technical skills. They offer real-time interactivity and the ability to update visuals as new data becomes available.
Self-Serve Tools and Templates
Many platforms offer drag-and-drop interfaces and pre-built templates that simplify the design process. This approach is cost-effective for routine reporting or internal presentations. However, the visual output often lacks the bespoke polish required for external-facing B2B marketing materials. Templates can make your content look generic, which may dilute your brand's unique value proposition.
Interactivity vs. Static Artwork
One key advantage of these platforms is interactivity. Users can hover over data points to reveal details, which is useful for web-based dashboards. However, for static infographics intended for white papers, case studies, or social media, these tools may require additional design work to look professional. If your goal is to create a standalone, high-impact visual asset, a design agency is often a better fit than a self-serve platform.
Freelance Designer Sourcing
Freelance designers offer a flexible and often more affordable option for creating infographics. They can be found on various freelance marketplaces or through professional networks. This channel is suitable for one-off projects or smaller budgets where a full agency retainer is not feasible.
Managing Quality and Communication
When working with freelancers, communication is critical. You must provide clear briefs, data sets, and brand guidelines to ensure the final product meets your expectations. Unlike agencies, freelancers may not offer strategic consulting or research support. You are responsible for curating the data and defining the narrative, while the designer focuses on the visual execution.
Scalability and Consistency
Freelancers are excellent for individual assets but may struggle with large-scale content programs. If you need a series of infographics that maintain a consistent style over time, managing multiple freelancers can be challenging. An agency provides a dedicated team that ensures consistency across all deliverables, reducing the risk of visual dissonance in your content library.
Sourcing Channel Comparison
| Feature | Specialist Agency | Visualization Platform | Freelance Designer |
|---|---|---|---|
| Strategic Research | Included | User-Provided | User-Provided |
| Brand Consistency | High | Medium | Variable |
| Cost Structure | Project/Retainer | Subscription | Hourly/Project |
| Best For | Thought Leadership | Internal Dashboards | One-Off Assets |
| Deliverable Type | Print-Ready Artwork | Interactive/Web | Digital Files |
Key Takeaways
- Specialist agencies provide strategic research and brand-aligned design, ideal for high-stakes B2B content.
- Data visualization platforms are best for interactive, real-time dashboards and internal reporting.
- Freelance designers offer flexibility and lower costs for one-off projects but require detailed briefs.
- Brand consistency is a critical factor; agencies ensure a unified visual identity across all assets.
- Agencies like Goodman Lantern deliver print-ready artwork, leaving physical production to the client.
- Research-first design ensures that infographics are factually accurate and persuasive.
- Choose your sourcing channel based on your need for strategy, interactivity, and budget.
Frequently Asked Questions
What is the difference between an infographic and a data visualization?
An infographic is a static visual representation of information, often combining text and graphics to tell a story. Data visualization is a broader term that includes interactive charts and dashboards used to analyze and present data sets.
Can a design agency handle the data analysis for me?
Yes, specialist agencies often include a research phase where they validate and structure your data before designing. This ensures the visualisation is accurate and strategically sound.
Do I need to print the infographics myself?
Yes, agencies typically deliver digital, print-ready files. You are responsible for sending these files to a printer or using them for digital distribution.
How much does it cost to hire a freelance designer?
Costs vary widely based on complexity and experience. Freelancers may charge hourly or per project, often at a lower rate than agencies but without included strategic services.
What file formats should I request from a designer?
Request high-resolution PDFs for print and PNG or JPG files for web use. If you need to edit the design later, ask for source files like Adobe Illustrator or InDesign.
How long does it take to design a B2B infographic?
Timelines depend on complexity. A simple infographic may take a few days, while a complex, research-heavy project can take several weeks.
Can I use data visualization software to create agency-quality designs?
While software can produce clean charts, it often lacks the bespoke branding and narrative structure that a professional design agency provides for external marketing materials.
Conclusion
Selecting the right partner for your B2B research infographics depends on your strategic goals and resources. If you need a comprehensive solution that includes research, strategy, and high-end design, a specialist agency is the best choice. For interactive internal tools, consider visualization platforms. For one-off assets, a freelance designer may suffice. To ensure your visual assets drive visibility and leads, consider partnering with Goodman Lantern for expert-led design and content creation.