

Where to Get Infographics and Data Visualisation for B2B Research
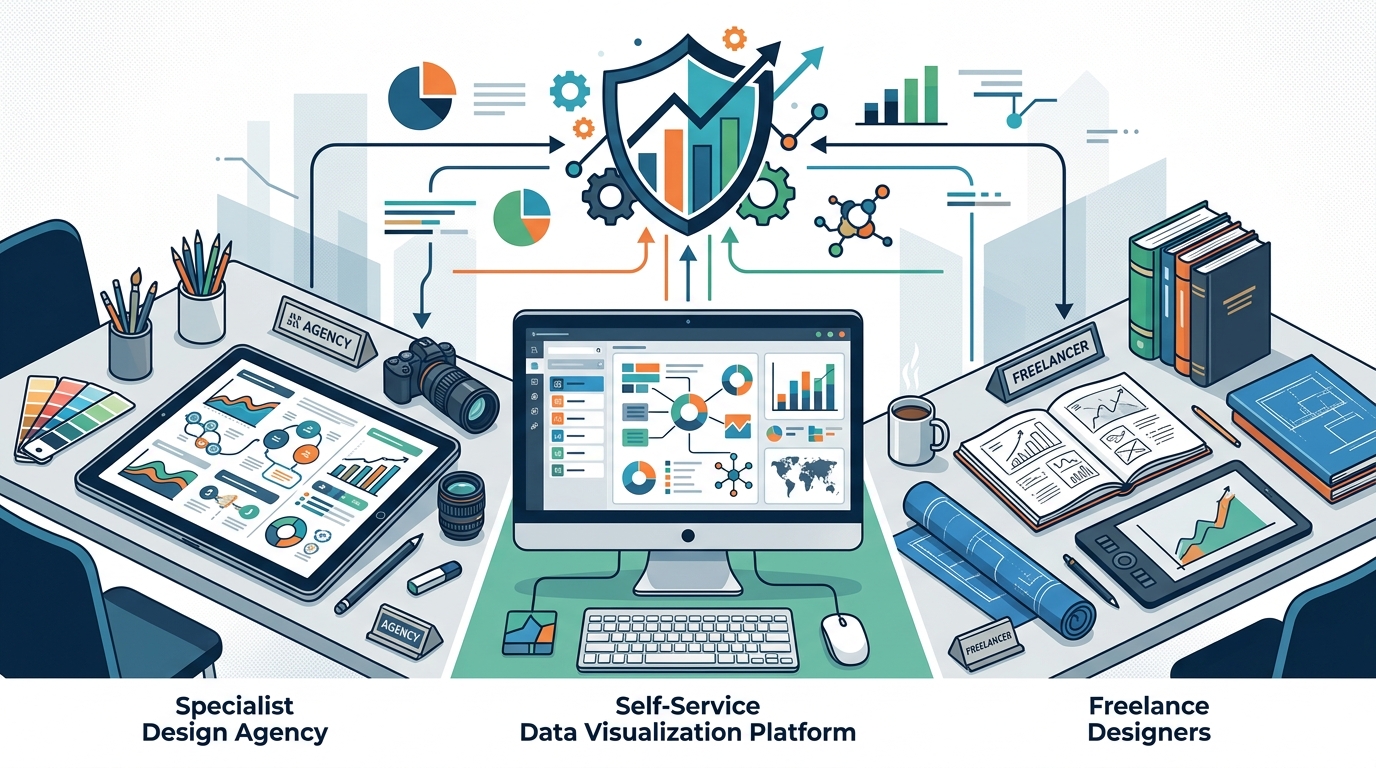
Businesses can source infographics and data visualisation from specialist design agencies, self-service data visualization platforms, or freelance designers. This guide explores the strengths, risks, and ideal use cases for each option. It helps B2B marketers choose the right partner to turn complex research into clear, shareable visual assets that drive engagement and authority.
Specialist Design Agencies
Specialist design agencies offer a comprehensive approach to visual communication. These firms combine strategic thinking with high-end graphic design capabilities. They are best suited for brands that need visual assets to align tightly with their broader marketing narrative.
Strategic Alignment and Brand Consistency
Agencies do not just create images; they build visual systems. They ensure that every infographic reflects your brand voice, color palette, and typography. This consistency is critical for B2B brands that rely on trust and authority. A content style guide is often the first step in this process, ensuring that visual and written elements speak with one voice.
Research-Driven Design
High-quality infographics require accurate data interpretation. Specialist agencies often work closely with research teams to ensure that the visual representation is factually correct and contextually appropriate. This reduces the risk of miscommunication, which can be damaging in professional sectors. For example, a content writing service that includes design support ensures that the narrative and the visuals are developed in tandem, not in isolation.
Scalability and Asset Management
Agencies can manage large volumes of assets. If you are launching a multi-channel campaign, you need infographics in various formats and sizes. An agency can handle the technical requirements for web, print, and social media. They also provide print-ready files, allowing you to handle physical production internally if needed. This scalability is a significant advantage over one-off freelance projects.
Data Visualization Platforms
Data visualization platforms are software tools that allow users to create charts, graphs, and dashboards directly from raw data. These tools are powerful for internal analysis and quick-turnaround external reports. They democratize data storytelling by putting design controls in the hands of analysts and marketers.
Speed and Interactivity
Platforms like Tableau, Power BI, or Looker Studio allow for the creation of interactive dashboards. These are ideal for B2B audiences who want to explore data themselves. However, static infographics for marketing collateral often require a different approach. While these platforms are excellent for data exploration, they may not always produce the polished, brand-specific static images needed for white papers or brochures.
Limitations in Branding
Most data visualization platforms have limited customization options for brand identity. You can change colors and fonts, but creating a unique, narrative-driven infographic that tells a specific story is difficult. The output often looks like a standard corporate chart rather than a compelling visual asset. This is where the gap between data analysis and marketing design becomes apparent.
Best Use Cases
Use these platforms for internal reporting, client-facing dashboards, and real-time data monitoring. For external marketing materials that require a strong narrative and high-end design, these tools are often insufficient on their own. They serve as the data backbone, but the final visual polish usually requires a designer.
Freelance Designer Sourcing
Freelance designers offer a cost-effective solution for specific, one-off projects. They can be found on platforms like Upwork, Fiverr, or through professional networks. This option provides flexibility and direct communication with the creator.
Cost and Flexibility
Freelancers often charge per project or per hour, which can be lower than agency retainers. This makes them attractive for startups or small teams with limited budgets. You can find designers with specific skills, such as data visualization or motion graphics, to suit your needs.
Risks and Challenges
The main risk with freelancers is consistency and reliability. A single designer may not have the bandwidth to handle large projects or may lack the strategic depth to understand complex B2B research. Communication can be challenging, especially across time zones. Additionally, ensuring that the designer understands the nuances of your industry and brand voice requires significant management effort.
When to Use Freelancers
Freelancers are best for simple infographics, social media graphics, or when you need a specific skill set that your internal team lacks. They are not ideal for large-scale content ecosystems or when strategic alignment is a top priority. For complex B2B research, the strategic layer provided by an agency is often missing in freelance engagements.
Comparison of Sourcing Options
The following table summarizes the key differences between the three main options for sourcing infographics and data visualisation.
| Feature | Specialist Design Agency | Data Visualization Platform | Freelance Designer |
|---|---|---|---|
| Strategic Alignment | High | Low | Medium |
| Brand Consistency | High | Medium | Variable |
| Cost | High | Medium (Subscription) | Low to Medium |
| Scalability | High | High | Low |
| Best For | Long-term brand authority | Internal analysis and dashboards | One-off projects |
Key Takeaways
- Specialist agencies provide strategic alignment and brand consistency, making them ideal for long-term B2B authority building.
- Data visualization platforms are best for internal analysis and interactive dashboards, but lack the narrative polish for external marketing.
- Freelance designers offer cost-effective solutions for one-off projects but may lack the strategic depth for complex research.
- Brand consistency is critical; ensure that visual assets align with your content style guide.
- Research-driven design ensures accuracy and context, reducing the risk of miscommunication in professional sectors.
- Scalability is a key advantage of agencies, allowing for the management of large volumes of assets across multiple channels.
- Communication and reliability are major risks when working with freelancers, requiring significant management effort.
- Choose the option that best fits your project scope, budget, and strategic goals.
Frequently Asked Questions
What is the difference between an infographic and a data visualization?
An infographic is a visual representation of information, often combining text and graphics to tell a story. Data visualization is the broader practice of representing data graphically to facilitate understanding. Infographics are a specific type of data visualization used for communication and marketing.
Can I use data visualization platforms for external marketing?
Yes, but with limitations. Platforms like Tableau or Power BI can export static images, but these often lack the brand-specific design and narrative structure needed for high-impact marketing materials. They are best used as a data source for designers.
How much does it cost to hire a design agency for infographics?
Costs vary widely based on complexity, brand requirements, and the agency's expertise. Specialist agencies typically charge premium rates for their strategic and design capabilities. It is best to request a quote based on your specific project scope.
Are freelance designers reliable for B2B research projects?
Freelancers can be reliable for simple projects, but they may lack the strategic depth and bandwidth for complex B2B research. Ensure you have a clear brief and strong communication channels to mitigate risks.
How do I ensure brand consistency in my infographics?
Develop a comprehensive content style guide that includes visual guidelines. Share this guide with your design partner to ensure all assets align with your brand identity.
What is the role of research in infographic design?
Research ensures that the data is accurate and the context is appropriate. It helps in identifying the key messages and the best way to visualize them. Without solid research, infographics can be misleading or ineffective.
Conclusion
Choosing the right source for your infographics and data visualisation depends on your strategic goals, budget, and project scope. Specialist design agencies offer the highest level of strategic alignment and brand consistency, making them ideal for B2B brands looking to build long-term authority. Data visualization platforms are powerful tools for internal analysis and interactive dashboards, while freelance designers provide a cost-effective option for one-off projects. By understanding the strengths and limitations of each option, you can make an informed decision that supports your marketing objectives. For brands seeking a partner that combines strategic research with high-end design, Goodman Lantern offers comprehensive content and design services that drive visibility and leads.